Annual Sea Flood Costs
Why is the content of this map important?
The maps illustrate projected annual sea flood costs in the 2080s, assuming that sea defences are built to reduce flood risk. This helps better understand where the greatest risks could be, plan for damages, and where appropriate, instigate further adaptation measures. By comparing the 2°C and 3°C maps, the benefits of climate mitigation may be realised.
Which sectors are affected by this result?
Sea-level rise threatens infrastructure, transport and housing. The results here are helpful for coastal planners and engineers, in terms of understanding where the coastal risks are.
What is shown on the maps?
The maps illustrates annual flood costs under a +2°C and +3°C (special map) global warming scenario, generated from a 0.31m and 0.42m rise in sea-levels respectively. Costs are reported in the 2080s under the SSP2 scenario (see background information), and assume that coastal defences are upgraded as sea-levels rise. Countries surrounding the North Sea tend to have the highest projected flood costs due to their low-lying coasts and/or long coastlines. However, some countries (e.g. the low-lying Netherlands) are more risk adverse than the modelled outputs as they have experience with devastating floods in the past so already have demand high protection standards. In this case projected flood costs would be lower.
Details and further information:
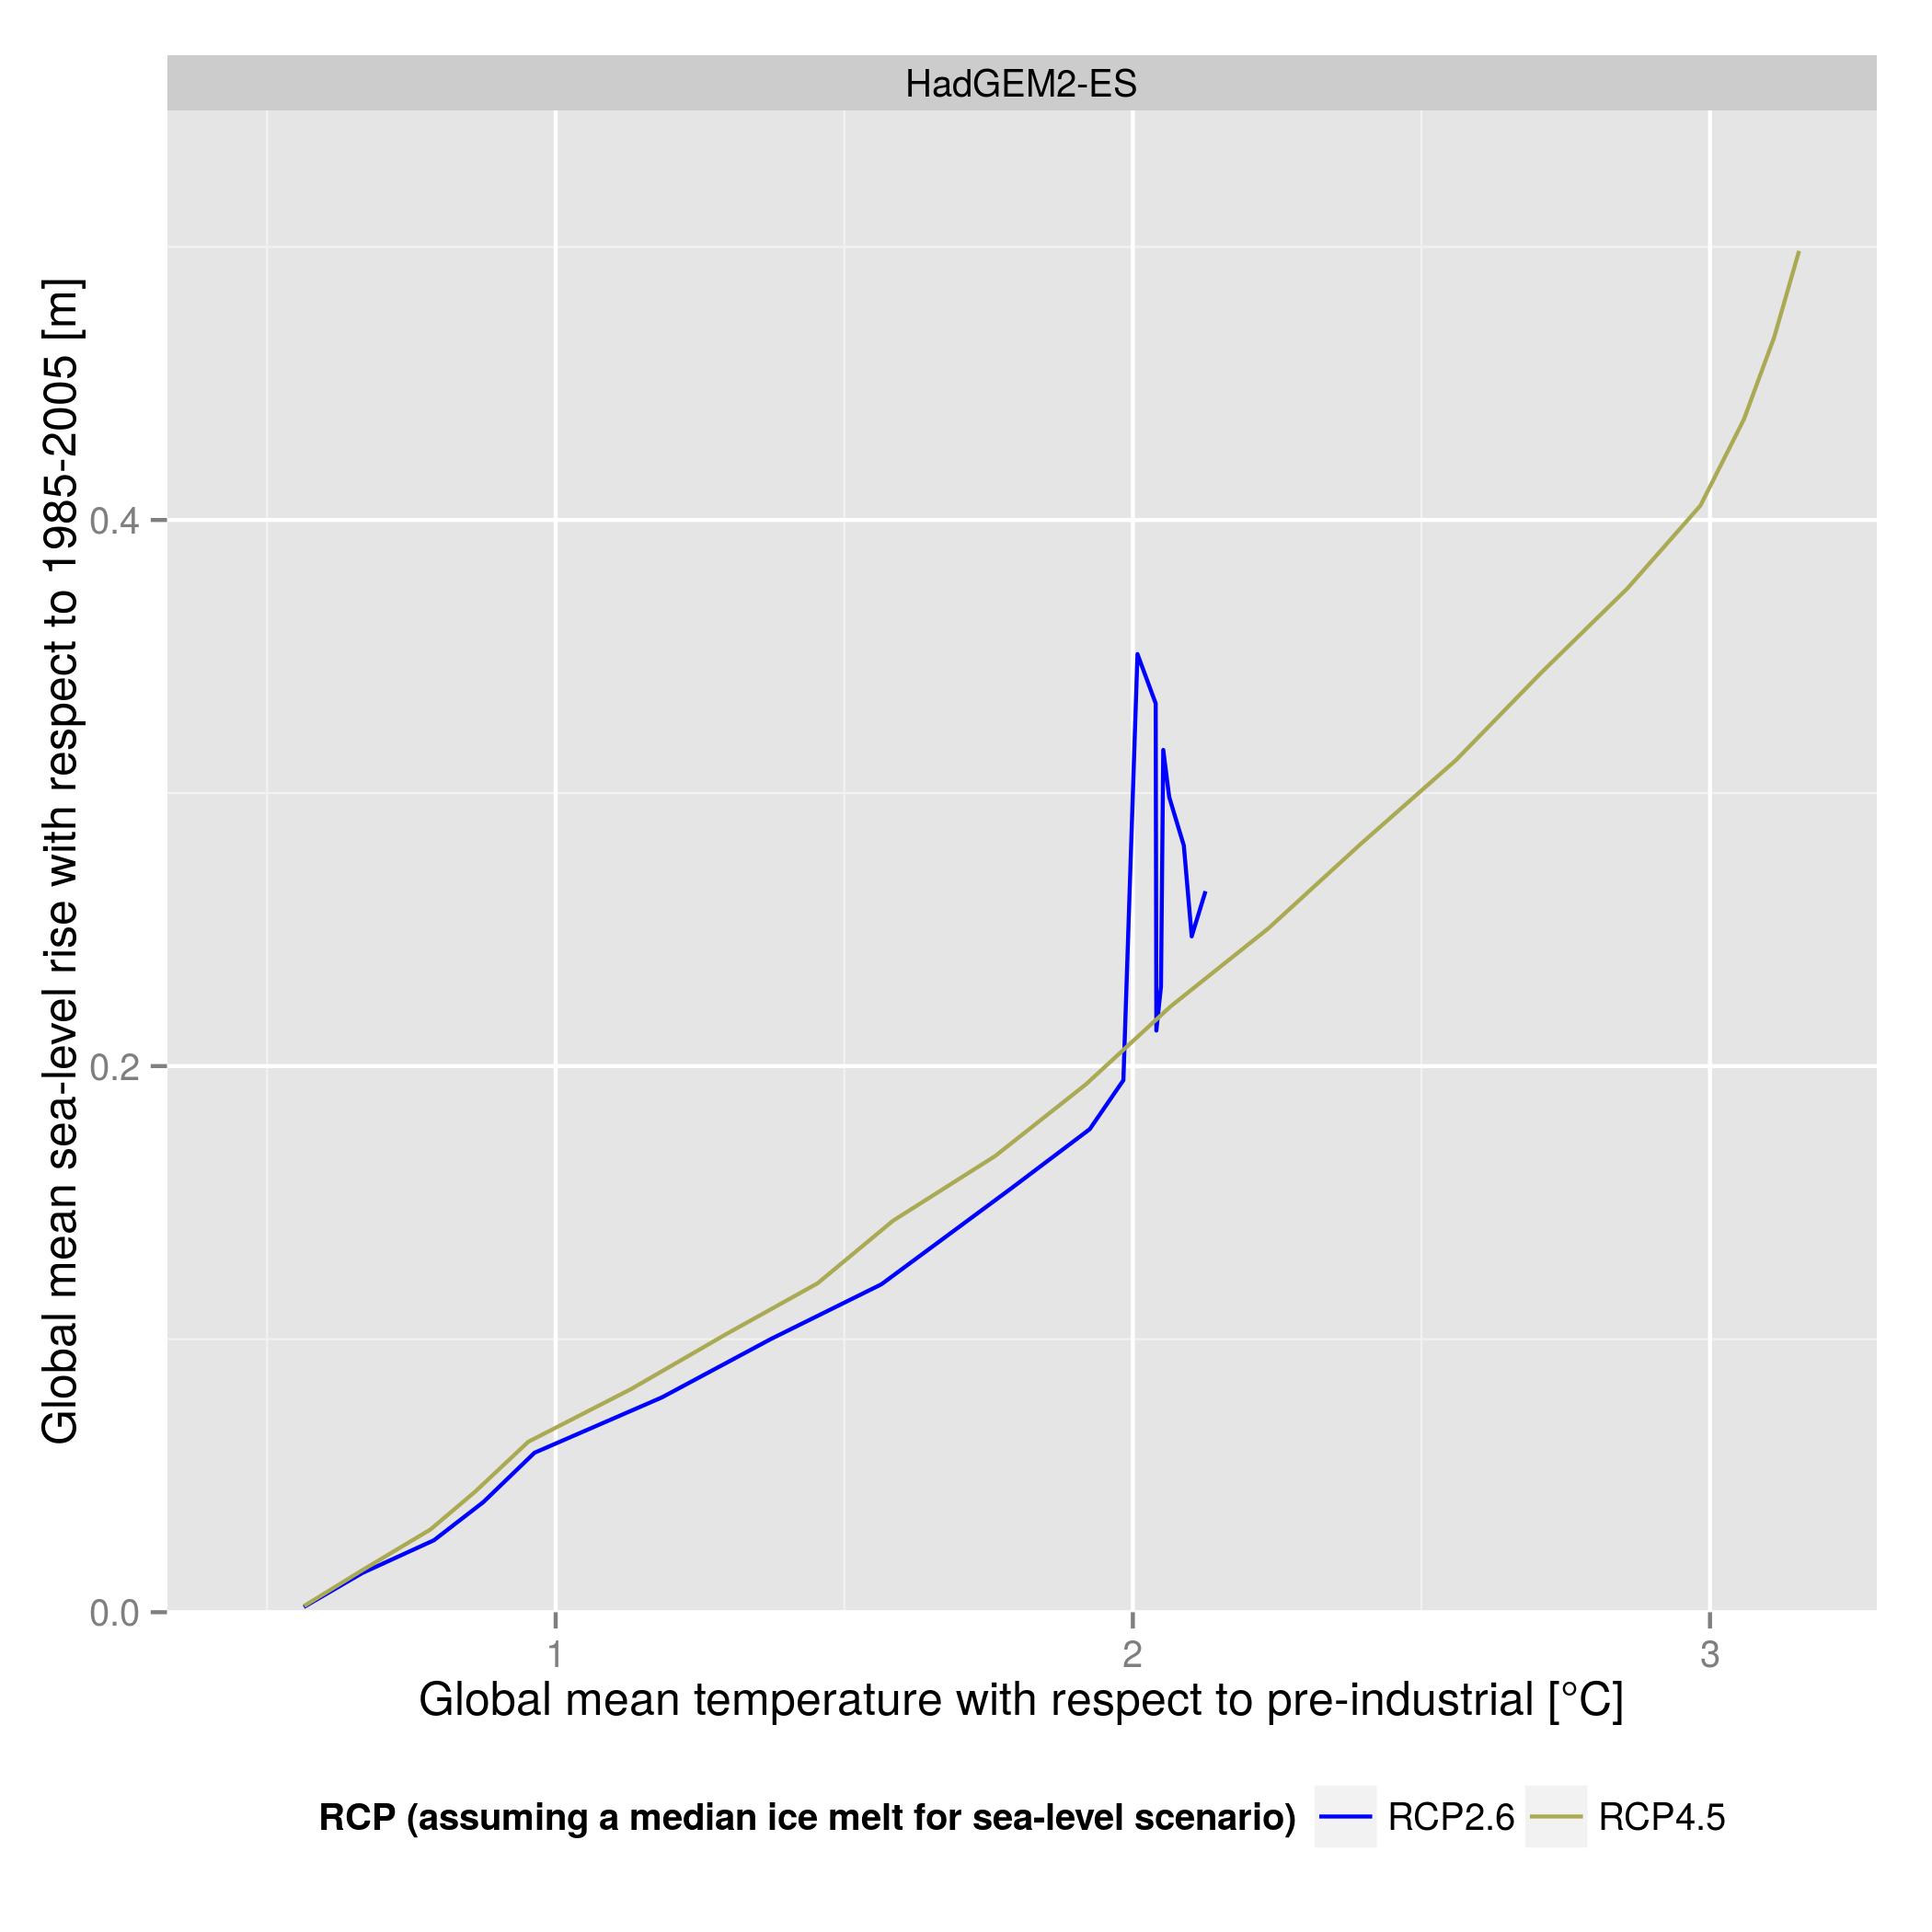
The benefits of mitigation are illustrated by the difference in global mean sea-level rise between the 2°C and 3°C global warming scenario as shown in the Figure:
 plotted against global mean temperature rise (with respect to pre-industrial) for HadGEM2-ES")
Due to large sea flooding costs, in absolute terms nations surrounding the North Sea will benefit most from climate mitigation. In relative terms, it is the small European economies, and small island states of Malta and Cyprus that receive the greatest benefit.
Sea-level rise does not rise instantaneously to global warming as there is a time lag between temperature rise and oceanic response. This is known as the commitment to sea-level rise. The commitment to sea-level rise happens because oceans take a long time to absorb heat down to their deepest parts, and also land ice takes time to melt. Therefore, we are committed to sea-level rise due to warming which has happened in the past. Thus, if global mean temperature increase stabilise at 2°C, the commitment to sea-level rise mean that sea-levels will keep on rising for decades to come.
For many impact studies, raising the global mean surface temperature by 2°C will produce an impact that may be apparent within hours to a few years. The situation is not as simple for the sea level rise as oceans can take many decades to respond to warming surface temperatures and ice sheets can continue to melt for hundreds of years, even if temperatures stabilise. Thus, in the project the impact of sea-level rise has been analysed at a range of temperature projections, focusing on the benefits of climate mitigation e.g. 2080s.
To investigate this, the Dynamic Interactive Vulnerability Assessment (DIVA) modelling framework was used. DIVA was driven by sea-level rise projections and socio-economic scenarios. Information on sea-level rise was taken from one model (HadGEM2-ES) and two emission scenarios. For a +2°C global warming sea-level rise is represented by the RCP2.6 simulation and is 0.31m. For a +3°C global warming sea-level rise is represented by the RCP4.5simulation and is 0.42m.
The socio-economic scenarios of the variables land-use class, coastal population growth and gross domestic product (GDP) growth correspond to the SSP2 scenario.
Author:
Sally Brown, Robert J Nicholls
University of Southampton (SOTON), United KingdomDaniel Lincke, Jochen Hinkel
Global Climate Forum, GermanySea-level scenarios were extracted from:
Hinkel, J., Lincke, D., Vafeidis, A.T. Perrette, M., Nicholls, R.J., Tol, R.S.J., Marezion, B., Fettweis, X., Ionescu, C. & Levermann, A., 2014. Impact of future sea-level rise on global risk of coastal floods. doi: 10.1073/pnas.1222469111.
The costs were generated from the Dynamic Interactive Vulnerability Assessment (DIVA) modelling framework. Further information about DIVA may be found at www.diva-model.net and the following references:
Hinkel, J., 2005. DIVA: an iterative method for building modular integrated models. Advances in Geosciences, 4, 45-50.
Hinkel, J. & Klein, R.J.T., 2009. Integrating knowledge to assess coastal vulnerability to sea-level rise: The development of the DIVA tool. Global Environmental Change 19(3): 384–395.
Vafeidis, A.T., Nicholls, R.J., McFadden, L., Tol, R.S.J., Hinkel, J., Spencer, T., Grashoff, P.S., Boot, G. & Klein, R.J.T., 2008. A new global coastal database for impact and vulnerability analysis to sea-level rise. Journal of Coastal Research, 24, 917-924.
Hinkel, J., Nicholls, R.J., Tol, R.S.J., Wang, Z.B., Hamilton, J.M., Boot, G., Vafeidis, A.T., McFadden, L., Ganopolski, A. & Klein, R.J., 2013. A Global Analysis of Coastal Erosion of Beaches due to Sea-level Rise: An Application of DIVA. Global and Planetary Change 111, 150–158.