Mean Water Temperature
Key messages:
-
Water temperatures are projected to increase almost all across Europe at +2°C global warming
-
Rising water temperatures combined with declining river discharge during summer in most parts of Europe are projected to reduce the availability of potential cooling water and thermoelectric power production
-
Nearly 100% model agreement in direction of change in water temperature
Why is the content of this map important?
Water temperature is an important indicator for cooling water potential and thermoelectric power generation, and also for freshwater ecosystem health. Increasing water temperatures combined with reduced streamflow may increase restrictions on cooling water use. If current environmental objectives were maintained, this would reduce the potential for thermoelectric power production.
Which sectors are affected by this result?
Water temperatures largely impact the
electricity sector and thermoelectric power production as well as ecosystem health.
What is shown on the maps?
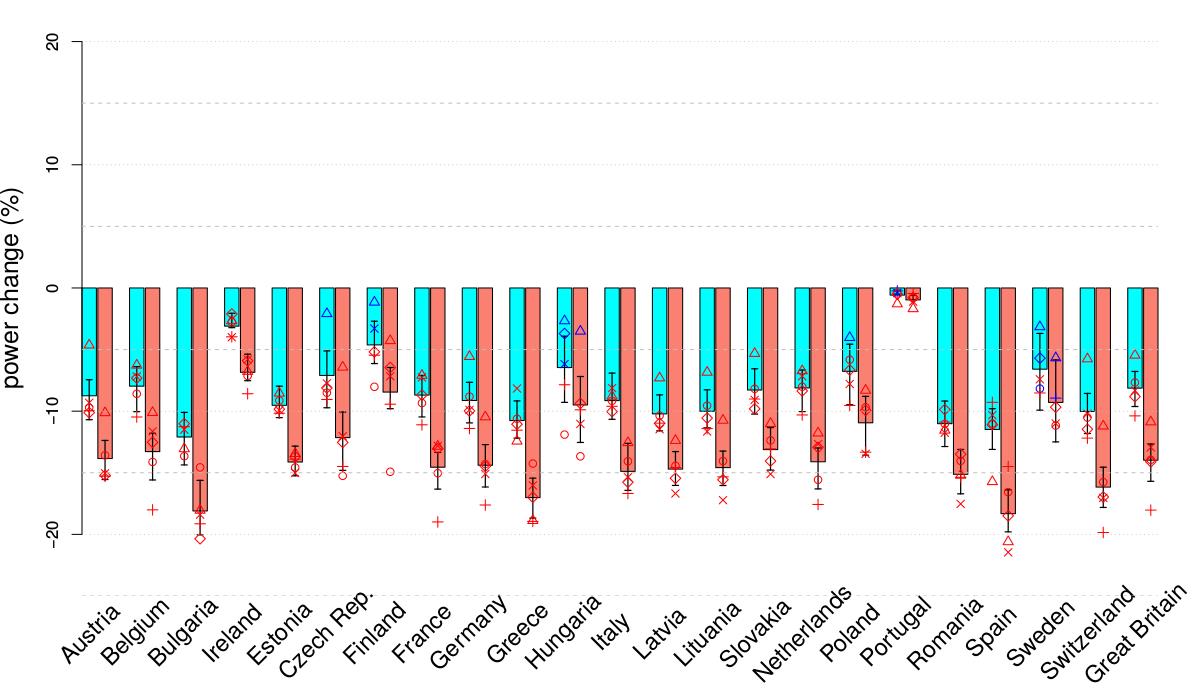
The maps show the increase in mean water temperature for the +2°C global warming period compared to 1971-2000 (reference period) based on 5 RCM-GCM experiments for RCP4.5. The results indicate a high agreement in change (almost 100%) for most parts of Europe showing robust increases in projected water temperature. Furthermore the impacts of projected increasing water temperatures combined with projected changes in streamflow on usable thermoelectric capacity for countries in Europe are shown (see
Figure). This is presented under both +2°C (cyan) and +3°C (salmon) global warming. Large declines in usable capacity are projected for most European countries with the largest decrease projected for southern and southeastern European countries (e.g. Bulgaria, Greece).

 Climate change impacts on national thermoelectric power usable
capacity under under a +2°C (cyan) and +3°C (salmon) global warming.
Details and further information:
Water temperature is modelled using the stream temperature model RBM (Yearsley, 2009) linked to the hydrological model VIC (Liang et al., 1994). The hydrological-water temperature modelling framework is scaled up to river basins in Europe (van Vliet et al., 2012, 2015). Projections of water temperature and streamflow are used to quantify impacts on cooling water use and usable thermoelectric power capacity using the model of Koch and Voegele (2009). In addition, data for 407 power plants (nuclear, fossil-, biomass-fuelled) in Europe are used. Simulated impacts are then aggregated to country level.
Additional information:
The ensemble of the five mandatory climate simulations is used as an input for the stream temperature model RBM. Hence, the ensemble consists of 5 simulations in total.
Author:
Michelle van Vliet
Wageningen Universiteit (WU), Netherlands
 Climate change impacts on national thermoelectric power usable
capacity under under a +2°C (cyan) and +3°C (salmon) global warming.
