Wind Energy Potential
Why is the content of this map important?
Wind energy has intensively increased its share in the renewable energy production over the past decade. Efforts to achieve a significant share in the European energy mix are being made. The potential for wind power production is closely dependent on the energy contained in near-surface winds and its potential future changes.
Which sectors are affected by this result?
The electricity sector and especially the wind energy sector are vulnerable to changes in wind energy resources. The assessment of future changes in wind energy resources is of interest for operating and planning activities in the wind energy industry. This may also be relevant for energy-climate policy makers.
What is shown on the maps?
Wind energy density is a measure of the energy contained in the wind regardless of wind turbine extraction technology. Wind energy density is stronger over sea than over land. Overall, the general spatial pattern of wind energy density is projected to hardly be affected under a +2°C global warming. The magnitudes of projected changes are of the order of 5% or below. However, the direction of change is uncertain over most of Europe. Nevertheless, the majority of models project a decrease over the Mediterranean region, the Atlantic Ocean and northern continental Europe. Consistent increases are projected over southeastern Europe and the Baltic Sea.
Details and further information:
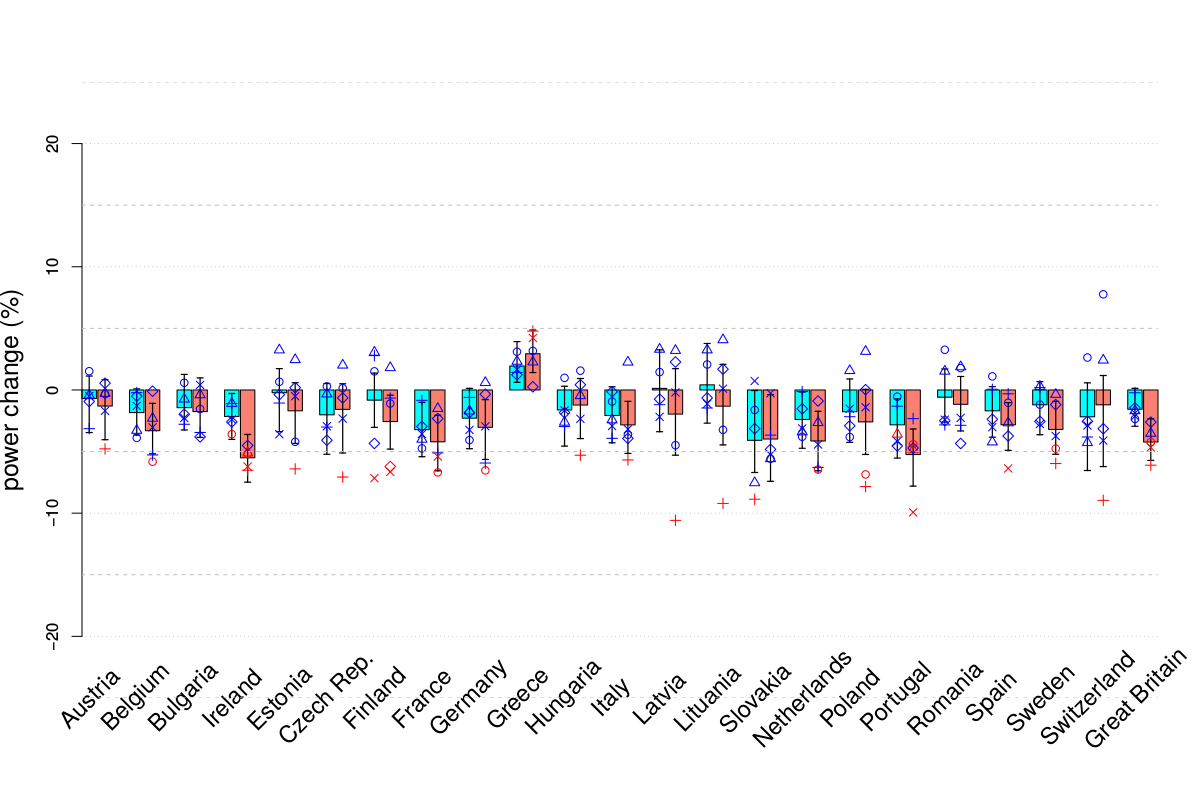
Based on the currently installed power capacity, changes in mean annual power production are consistently projected to be smaller than 5% in magnitude at the national and European scale. However, the direction of change is uncertain for most countries (see Figure). These changes cannot be distinguished from natural climate variations. Global warming by 3°C (salmon colour) is projected to lead to slightly stronger changes compared to global warming by 2°C (blue colour).
 under a +2°C (cyan) and +3°C (salmon) global warming.
Changes are expressed in percents with respect to the 1971-2000 reference period.
The colored wide bars indicate the model ensemble mean. The thin bars indicate
the 95% level confidence interval as computed using the Wilcoxon-Mann-Whitney
test. Model individual changes are represented by differing symbols: symbols are
red when changes are significant at the 95% level using the Wilcoxon-Mann-
Whitney test.")
The effects of +2°C global warming on the wind power sector have been assessed both in terms of wind power potential at the grid point scale over Europe and in terms of wind power production as generated by current and planned wind farms at the national level for the different European countries.
Wind power potential is estimated at the grid point scale using two quantities: wind energy density, which corresponds to the energy flux carried in the wind at the turbine levels, and the wind power extracted by a standard wind turbine. Data for the analyses is taken from the five mandatory climate simulations. Hence, the ensemble consists of 5 simulations in total.
Wind power production is calculated using the wind turbines' current characteristics (installed power, location) taken from thewindpower.net database and a 2050 installed power scenario defined with the CLIMIX model.
Author:
Isabelle Tobin
Centre national de la recherche scientifique (CNRS-IPSL), France